
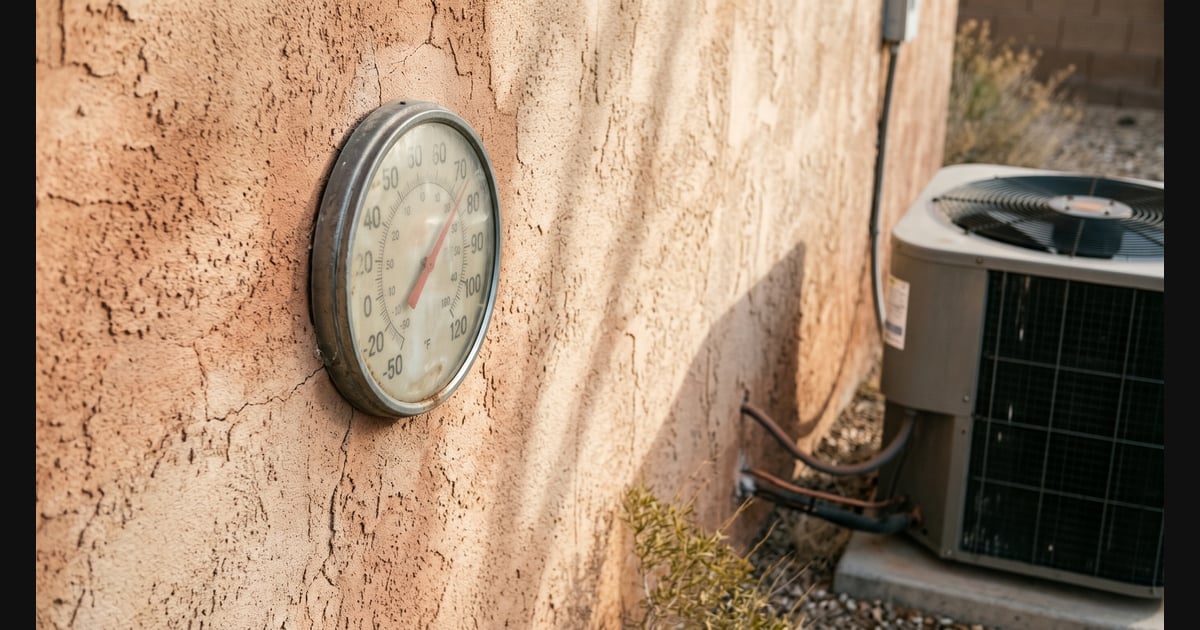
Read the Gauges While the Air Conditioner Still Works
November is mild in Phoenix, which makes it the best morning to inspect a peer-reviewed July blackout model, a real public plan, and one meeting anyone can attend.
On a Sunday morning in late November, Phoenix feels like a gift. Patios are open, the desert air is cool enough for a light jacket, and nobody standing in line for coffee is thinking about July. That is precisely when a pilot checks the instruments—while the sky is clear and the engine is still turning smoothly. What follows is not a scene from today's sidewalk; it is a peer-reviewed engineering model of a five-day July heat wave paired with Phoenix's own 2026 public records, read in the quiet before Thanksgiving so we can see how a modern city actually behaves when the lights stay out.
As I wrote on Friday in When Everything Runs on Duct Tape, Peace Is the Only Answer, we spend an awful lot of energy arguing over national personalities while the physical systems keeping us alive run on thinner margins every year. Official emergency pamphlets tell us to stash 72 hours of canned goods in a hall closet. Cable news and Hollywood offer the opposite story: turn off the power and neighbors turn feral by hour 73.
Both stories dodge the physics. Modern American cities are life-support machines disguised as real estate. When you put away the slogans and read the gauges, a very different picture appears.
What Actually Breaks in Phoenix
In May 2023, researchers led by Brian Stone Jr. at Georgia Tech and Matei Georgescu at Arizona State University published a study in Environmental Science and Technology modeling what happens when a five-day heat wave—daily highs at or above 109 degrees—collides with a 48-hour citywide blackout and a 72-hour staged restoration in Phoenix.
Without air conditioning, indoor heat exposure climbs by more than six degrees Celsius on average. Within days, more than 800,000 Phoenix residents—over half the urban population—would require emergency medical care, crashing into a regional hospital system with roughly 3,000 emergency department beds. Modeled deaths reached roughly 13,250, nearly one percent of the city's population.
Engineering work by Susan Spierre Clark and Mikhail Chester at Arizona State University maps why the failure cascades so fast: lose the electrical grid and you stall the pumps moving water through the Central Arizona Project (CAP), shut down gas station pumps, kill traffic signals, and watch superheated air thin out enough to ground commercial aircraft.
Quiet Rooms Beat Movie Myths
Hollywood loves a blackout riot because riots film well. Half a century of disaster sociology tells a calmer, stranger truth. Enrico Quarantelli, co-founder of the Disaster Research Center, reviewed nearly 700 field studies and found that true mass panic is virtually nonexistent. When infrastructure fails, ordinary people stay remarkably rational and carry out the vast majority of initial search, rescue, and neighbor checks themselves.
The real killer in Phoenix is quiet, solitary, and indoors. In the City of Phoenix 2026 Heat Response Plan, Maricopa County's own mortality surveillance reports a sobering fact: among indoor heat-related deaths tracked through the end of 2025, 89 percent happened inside a home that had air conditioning—it was simply turned off or not working. Not gangs in the street. Just a failed unit, a shutoff, or a dead circuit behind a closed door where nobody knocked.
The engineering numbers also carry real hope. In that same 2023 study, straightforward passive adaptations like cool roofs reduced modeled heat deaths by an average of 37 percent and emergency visits by 48 percent across the study cities. Margins are not magic; they are built.
Who Built the Fragility—and Who Is Fixing It
It is easy to blame a desert city for growing faster than its grid, and harder to look squarely at why so many of us feel powerless to steer what comes next. According to Pew Research Center, just 17 percent of Americans trust the federal government to do what is right most of the time; Gallup puts confidence in Congress at 9 percent. Yet in October 2026, Gallup found that 67 percent of Americans still trust their local government.
Read that again. The trust is not gone. It is already local.
And in Phoenix, real people are already doing the repair work in plain sight. The City of Phoenix Office of Heat Response and Mitigation coordinates more than 15 city departments across 23 programs in its 2026 Heat Response Plan—running 24/7 heat respite sites, extended-hour cooling centers, and the Shade Phoenix Plan adopted by the city council. That groundwork helped Maricopa County record its first year-over-year drop in heat-related deaths since 2014, falling from 645 in 2023 to 602 in 2024. On the power side, APS published its 2026 Integrated Resource Plan (IRP) earlier this month with public stakeholder hearings before the Arizona Corporation Commission, putting its load forecasts and reliability math where any citizen can read them.
We owe public servants and line crews honest credit when they put the numbers on the table—and then we owe them our presence in the room.
One day at a time is how a person recovers. One town at a time is how a country does. When I talk about rising up as citizens, I mean something plain and sturdy: rising up looks like showing up—nonviolent, lawful, and in the open.
Organize Here: One Document, One Room, One Hour
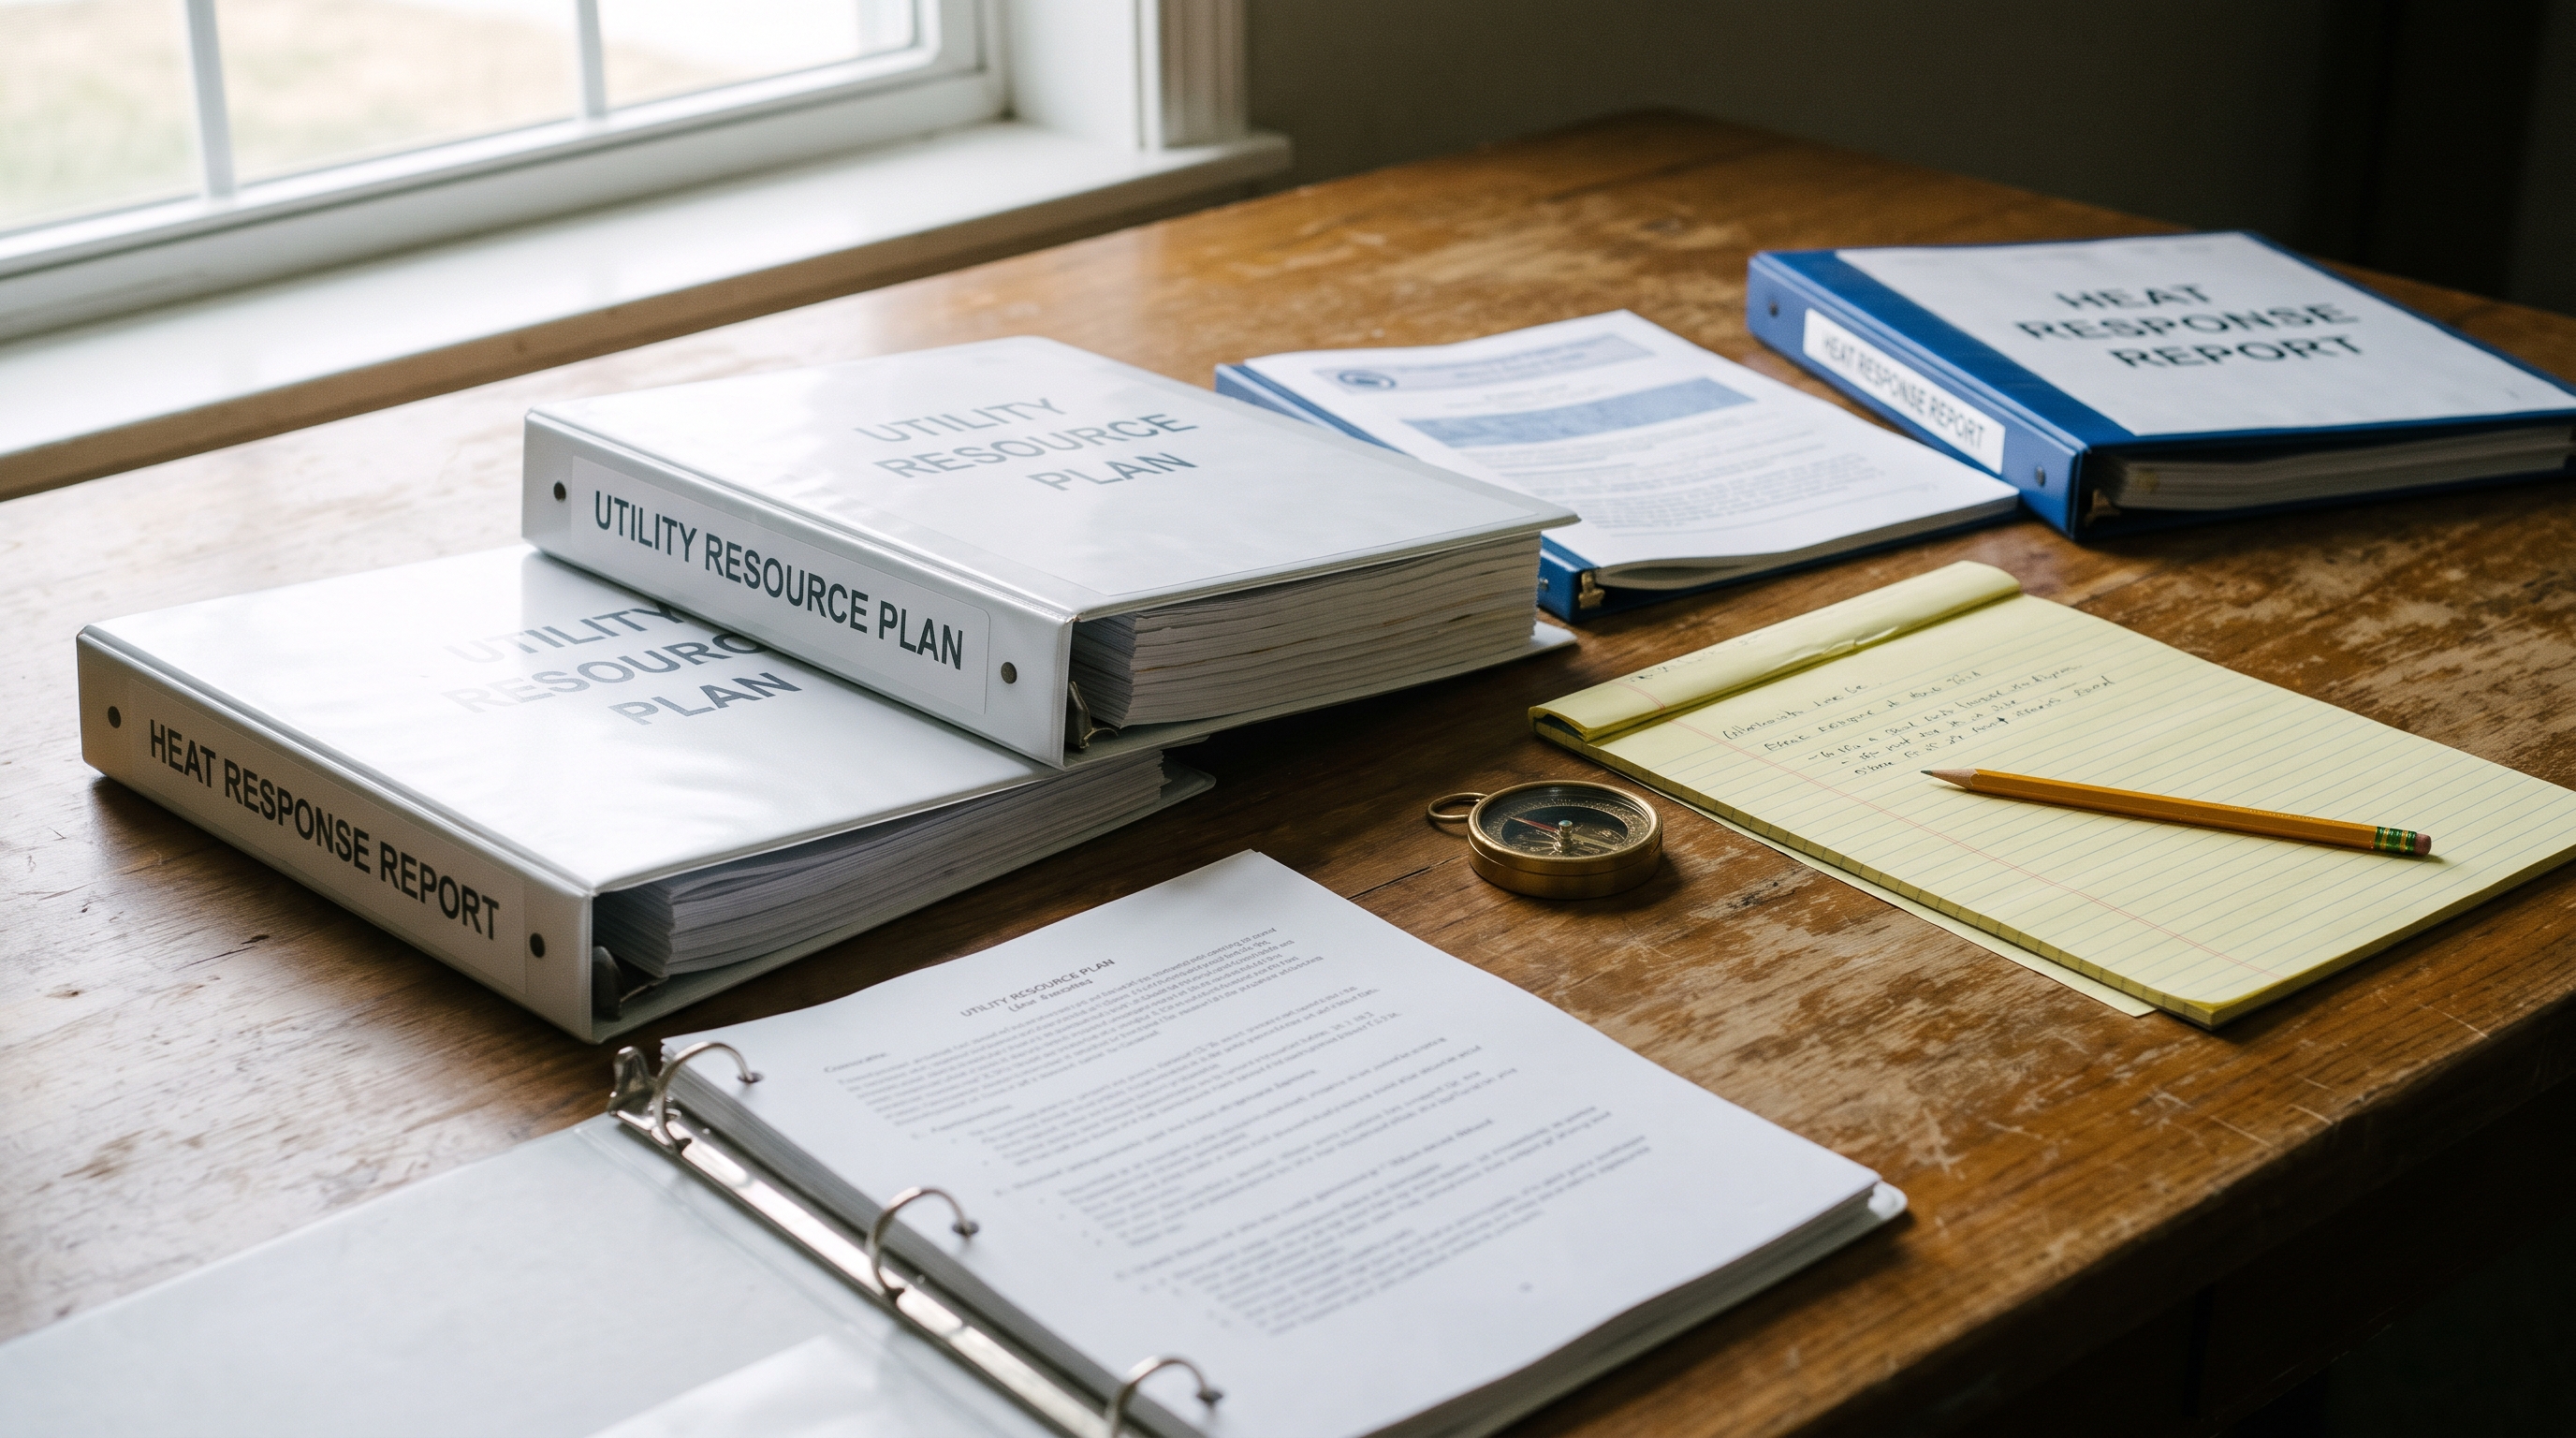
You do not need to live in Maricopa County to run this stress test. Every city and county has its own version of Phoenix's two core public records: a municipal hazard or heat/cold response plan and your electric utility's Integrated Resource Plan (the long-range grid forecast filed with your state utility regulators).
In Phoenix, the public rooms where those margins are decided are the Phoenix City Council and the Arizona Corporation Commission (which takes written public comment online through its eDocket and in person at open meetings). Wherever you live, your equivalent rooms are your city council or county commission and your state public utility commission.
One hour this week: Check your own town's gauges
- Household: Check the one climate-control system your home cannot live without—whether AC condenser or winter furnace—and write down how your household stays safe for 48 hours if wall power drops
- Block: Knock on the door of one older, medically vulnerable, or solo neighbor on your street this week and trade phone numbers on paper before a crisis hits
- Room (under one hour): Download your city's emergency heat or winter plan or your utility's latest Integrated Resource Plan, highlight one peak-load or shelter-capacity number, and put the next open meeting of your city council or state utility commission on your calendar
If you want the full engineering citations behind the Phoenix model, I have placed the complete research dossier in our Library at When the Grid Stays Down. Pull one document this week. Walk into one room with a neighbor. That is where real resilience starts.
Everything here is free. If this one helped you, there’s a tip jar.